


Price fluctuations vary in response to a wide range of local and global factors in the financial markets, which form an enormous ocean of data. For the intelligent investor, navigating these seas needs knowledge of the various navigational tools in addition to instincts. The silver price chart is the main guide when it comes to valuable metals. It is a visual language that, when decoded, reveals the underlying mood and possible future direction of the asset rather than just a record of past worth. Anyone wanting to profit from the special instability and growth potential of silver must know how to read these charts.
The Anatomy of Price Visualization
Although a price chart is basically a graphical depiction of value over time, its simplicity hides the richness of information it can provide. The candlestick chart, the most famous kind, gives a detailed picture of market action. Every “candle” shows the starting, closing, high, and low prices for a certain time period, which might range from minutes to months. A green or white candle often shows bullish mood when the finishing price exceeds the opening, whereas a red or black candle signifies negative pressure.
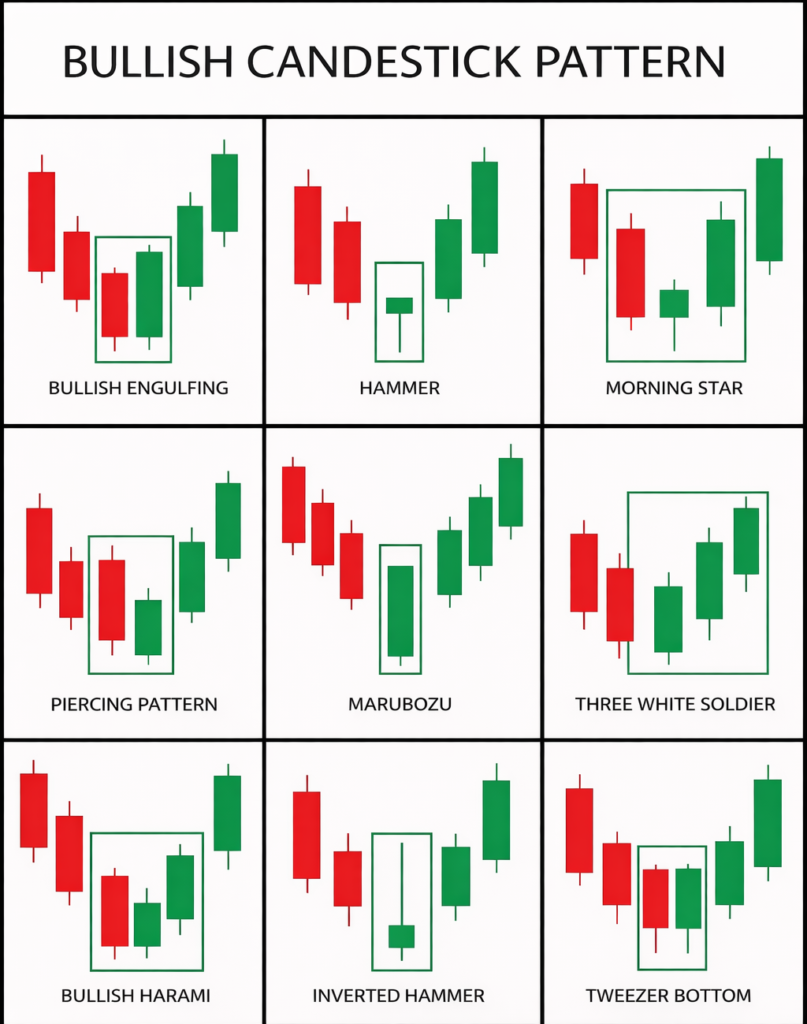
Investors can spot the tug-of-war between buyers and sellers by analysing these trends. For instance, longer “wicks” or shadows on a candle might suggest a rejection of higher or lower prices, marking a likely reversal. An investor can spot market uncertainty or confidence before it shows itself as a persistent trend by being skilled in this visual lexicon.
Decoding Trends and Momentum
Finding the market’s leading direction is basic analysis’s main goal. Known for having a higher beta than gold, silver frequently shows sudden and lasting changes. A sequence of rising highs and higher lows that suggest that demand is regularly surpassing supply characterises an uptrend. On the other hand, a decline is suggested by lower highs and lower lows. Moving Averages (MA) are one tool that helps reduce daily volatility noise and show the asset’s real trend. Seeing how the short-term and long-term moving averages interact is a common method. Investors are usually urged to consider taking entry positions when a shorter-term average goes over a longer-term one.
The Significance of Localized Pricing
For the physical investor, the local environment is just as important as the global spot prices, which serve as a basis. The silver rate in Bangalore, for example, is a composite value that mixes international trends with regional factors such as import taxes, currency exchange rates, and local supply chain dynamics. Local holidays or wedding seasons in a big demand hub like Bangalore may keep domestic prices high due to a scarcity premium, even though a standardised global chart could show a decline. In order to make an informed business decision, the local basic environment must be superimposed with the global technical picture. Monitoring the exact silver rate in Bangalore alongside international charts ensures that one is not blind-sided by regional price differences.
Identifying Support and Resistance Levels
Support and resistance levels are psychological walls formed by the repetition of price history. Support is a price floor where buying demand has generally been strong enough to thwart selling pressure and keep the price from declining any lower. The opposite is resistance, which is a ceiling when a rise is generally stopped by selling interest.
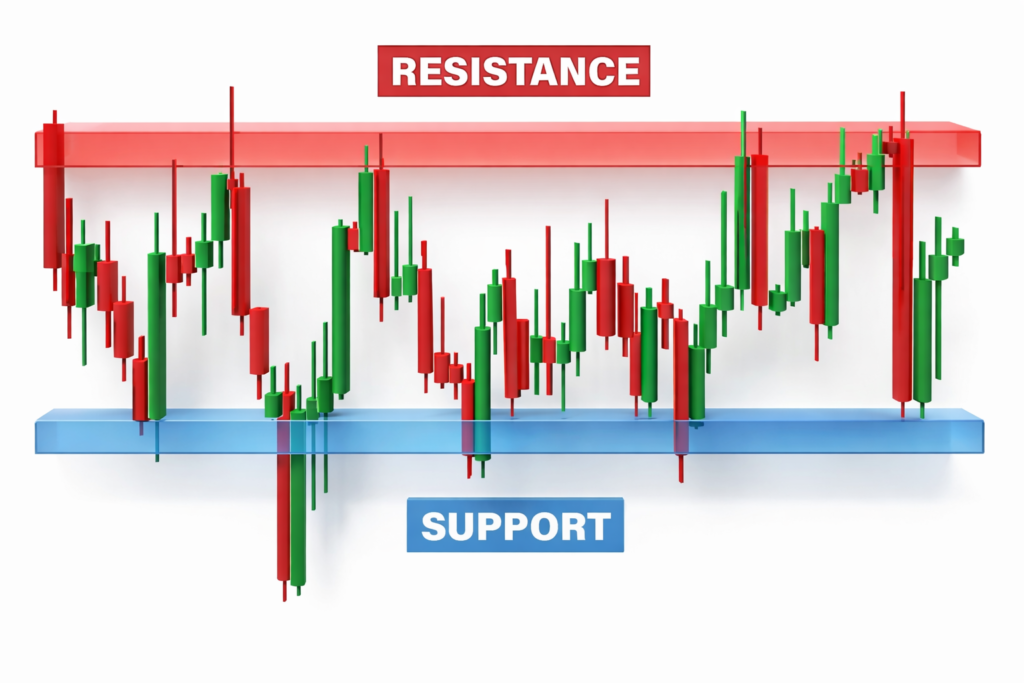
For the purpose of timing entrances and exits, it is important to identify these zones on a silver price chart. Purchasing at a strong support level often offers a good risk-to-reward ratio, since the market has proved unwilling to drive prices lower in the past. On the other hand, it could be smart to lock in gains or wait for a confirmed breakthrough before increasing a position when a major resistance level approaches.
Volume as a Confirmation Tool
Volume gives the proper background; price action alone can occasionally be confusing. The total number of shares or contracts exchanged over a certain length of time is indicated by volume. Strong involvement and confidence are shown by a notable price movement and sizable volume, which supports the trend. However, a price rise on low volume implies a lack of institutional backing and is usually a forerunner to a reversal. Astute investors always check for a volume rise when studying a breakout from a chart pattern to make sure the move is real and sustained.
Synthesizing Data for Strategic Execution
In the end, integration is what makes charts successful. Success cannot be ensured by a single pattern or sign. Before making a deal, the most diligent investors create a confluence of proof by combining volume data, support/resistance zones, and trend study. One may easily control risk by seeing the chart as a probability map rather than a crystal ball. Whether the aim is long-term asset protection or short-term speculative gain, the ability to read the charts turns the chaotic noise of the market into an organised story of opportunity.