


Xmaster Formula MT4: The Complete Guide to Trend Detection and Precision Trading
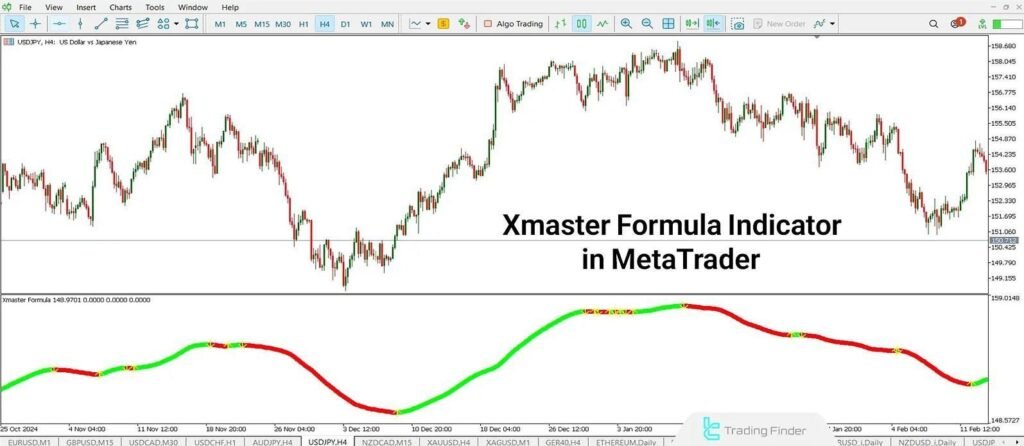
One of the most widely discussed tools among MetaTrader users today is the Xmaster Formula MT4 indicator. Designed as a hybrid system combining Moving Averages and MACD calculations, this indicator helps traders detect both the strength and direction of a trend with impressive precision.
Unlike conventional oscillators, the Xmaster Formula MT4 indicator is visually simple yet internally complex, built to process volatility, momentum, and direction into easy-to-read buy and sell signals.
What Is the Xmaster Formula Indicator?
The Xmaster Formula Indicator, also known as Xmaster Formula MT4 or sometimes mistakenly referred to as XHMaster, is an analytical tool that merges moving average and oscillating momentum data into a single output.
Its algorithm measures volatility deviation and momentum synchronization to highlight overbought and oversold zones.
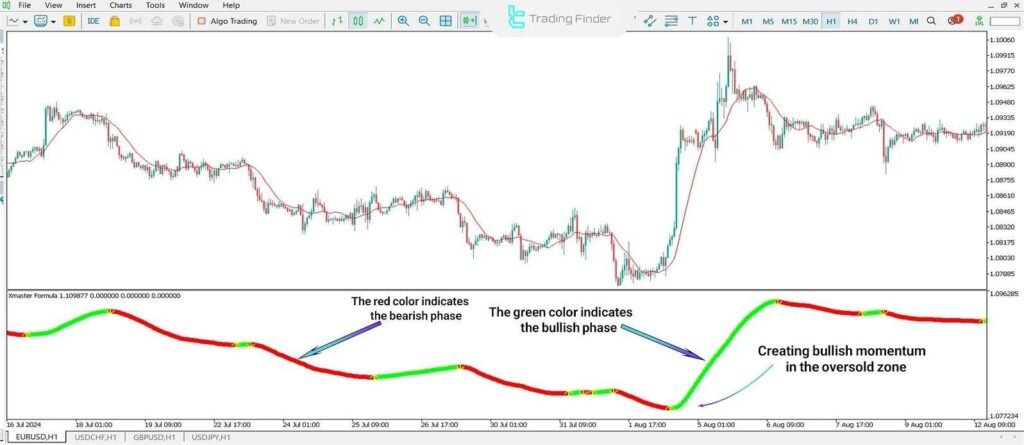
On the chart, green lines typically represent bullish (upward) momentum, while red lines mark bearish (downward) conditions or weakening trends. These visual cues help traders easily identify whether the market is in a buying or selling phase.
A developer from TradingFinder, the team behind this tool, explained that many traders search for “XHMaster” instead of “Xmaster,” which often leads to confusion. The correct name, however, is Xmaster Formula.
How the Xmaster Formula MT4 Works
At its core, Xmaster Formula MT4 processes market direction and momentum in several algorithmic steps:
- Volatility Mapping: The indicator measures recent price fluctuation ranges and sets a dynamic threshold for calculation;
- Adaptive Moving Gradient: It calculates the slope of price movements using modified moving averages. When the slope crosses a certain angle, the system identifies a potential phase change;
- Noise Filtering: Using deviation filters, Xmaster removes random market noise and short-term spikes that could trigger false alerts;
- Trend Alignment: The indicator aligns medium-term price action with dominant market direction to confirm signals;
- Signal Visualization: The processed data appear as color-coded lines or arrows; green for Bullish momentum or uptrend, red for Bearish momentum or trend weakness, and yellow for Neutral or consolidation zone.
This multi-layered approach allows Xmaster Formula MT4 to convert raw market data into actionable information with minimal lag.
Advantages and Disadvantages of the Xmaster Formula MT4
Like all indicators, Xmaster Formula has its strengths and limitations. Understanding both is key to using it effectively.
Advantages:
- Fast Trend Reversal Detection: The adaptive algorithm quickly identifies market turning points;
- Clear Visual Design: Color coding simplifies decision-making for all skill levels;
- Reliable on Lower Timeframes: Works effectively on M5 and M15 charts; ideal for scalping;
- Combines Momentum and Direction: Improves the validity of buy/sell signals;
- No Repaint Feature: Signals remain fixed once generated, ensuring data stability.
Disadvantages:
- May produce false signals in highly volatile markets;
- Volume data is not included in its calculations;
- Slower reaction on higher timeframes (H4 or daily);
- Requires additional confirmation tools such as RSI or MACD for exit points.
Despite these drawbacks, many traders still prefer Xmaster MT4 because of its accuracy and non-repainting signal structure, features that are critical in real-time trading.
Overbought and Oversold Detection
Another valuable feature of Xmaster Formula MT4 is its ability to detect overbought and oversold zones.
- When the line turns red at the top of the chart, it often indicates an overbought condition and potential reversal downward;
- When the line turns green at the bottom, it suggests oversold conditions and a possible bullish recovery.
Traders use these cues to time their entries for mean-reversion or reversal strategies.
No-Repaint Assurance in Xmaster Formula MT4
One of the biggest concerns with free MT4 indicators is repainting, where signals disappear or change after new data arrives. The Xmaster Formula MT4 stands out because its signals do not repaint once confirmed.
This ensures traders can rely on what they see in real-time without worrying that previous signals will vanish. The non-repaint feature makes Xmaster ideal for both live and backtested strategies.
Common Mistakes When Using Xmaster Formula MT4
To get the most from this indicator, avoid these typical errors:
- Using it alone: Always confirm with another tool (RSI, EMA, or Bollinger Bands);
- Ignoring timeframe alignment: Ensure the signal aligns with the higher timeframe trend;
- Default settings for all assets: Adjust sensitivity based on market volatility;
- No stop-loss: Every trade should have predefined risk control;
- Skipping backtesting: Test the indicator on historical data before going live.
By avoiding these mistakes, traders can fully exploit the predictive strength of Xmaster Formula MT4.
Evolution of the Xmaster Formula (2020–2025)
Over the past few years, the Xmaster Formula Indicator has evolved from a simple trend detection indicator tool into a high-precision, multi-purpose analytical system.
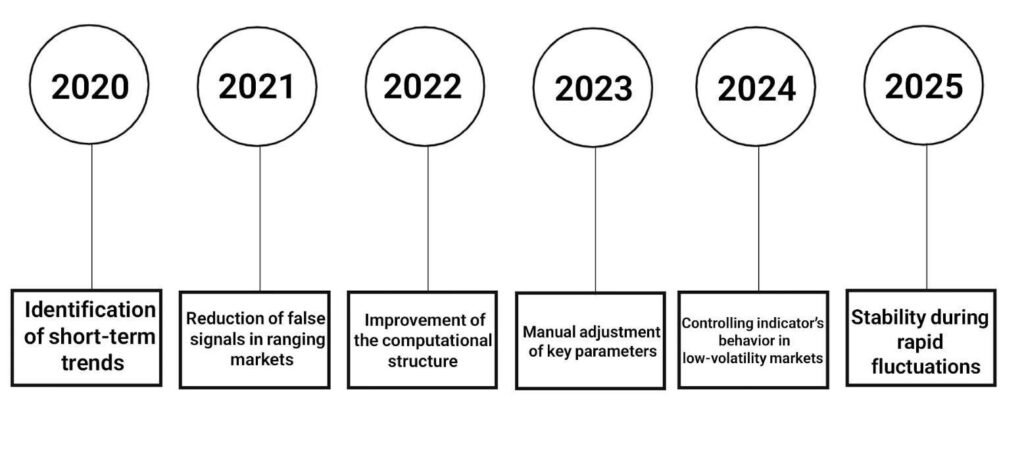
The 2020–2025 period can be considered the phase of technical development and the establishment of its position among market volatility and direction analysis tools:
- 2020: Early versions focused on basic trend reversal detection;
- 2021: Smart filters were added to reduce false signals;
- 2022: Improved momentum recognition increased reliability during trending phases;
- 2023: Customizable sensitivity and volatility thresholds introduced;
- 2024–2025: Signal stabilizers and whipsaw filters optimized performance under low volatility.
These continuous updates made Xmaster MT4 a trusted companion for both beginner and professional traders.
Best Indicators to Use Alongside the Xmaster Formula MT4
While the Xmaster Formula MT4 indicator offers powerful trend and momentum insights, combining it with complementary technical tools can significantly improve accuracy and decision-making.
Using multiple indicators allows traders to confirm signals, filter false entries, and gain a broader perspective on price action.
To have better results, we recommend combining the Xmaster Formula MT4 by TradingFinder with these three highly regarded and widely trusted indicators from MetaQuotes and LuxAlgo:
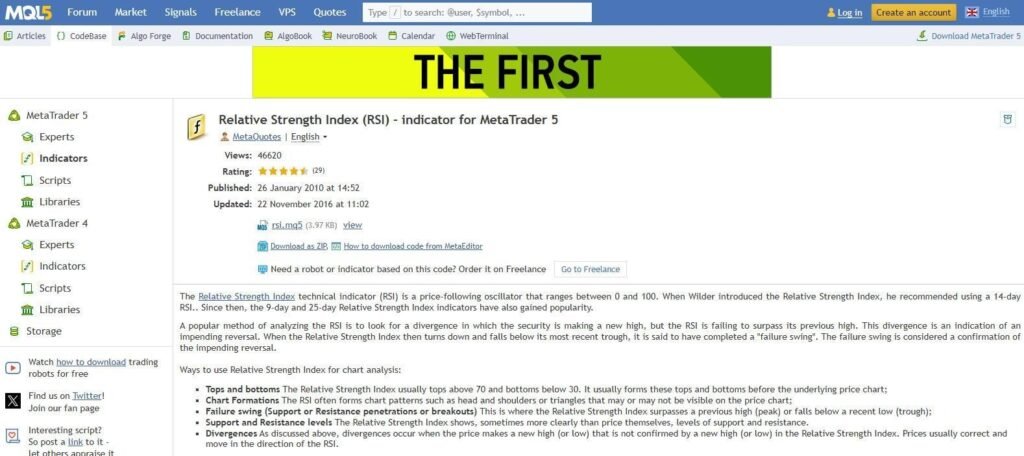
Relative Strength Index (RSI) by MetaQuotes
The Relative Strength Index (RSI), developed by J. Welles Wilder Jr., is one of the most reliable momentum oscillators used in trading. It measures the magnitude of recent price changes to evaluate overbought or oversold market conditions.
RSI values range between 0 and 100, with readings above 70 often suggesting overbought zones and readings below 30 indicating oversold levels.
When used alongside the Xmaster Formula, the RSI helps validate the strength of a signal.
For instance, if Xmaster displays a buy signal but the RSI remains in overbought territory, traders may choose to wait for a pullback before entering. Conversely, a buy signal supported by an RSI rebound from oversold levels can strengthen trade confidence.
Bollinger Bands Breakout by LuxAlgo
The Bollinger Bands Breakout Oscillator is a specialized tool for detecting price breakouts using Bollinger Bands.
It evaluates how strongly price movements deviate from the upper and lower band boundaries, helping traders identify potential trend shifts.
The indicator’s behavior is shaped by three main settings:
- Length, which determines how responsive it is to recent price changes;
- Mult, a multiplier that adjusts band width and breakout sensitivity;
- Src, which allows traders to choose the input data source.
In practice, the oscillator displays green zones for bullish breakouts and red zones for bearish ones; the larger the zone, the stronger the breakout signal.
Increasing the Mult value widens the bands, filtering out weaker signals and highlighting more meaningful market moves.
Average Directional Index (ADX) by MetaQuotes
The Average Directional Index (ADX) is a cornerstone indicator in trend analysis, designed by the same J. Welles Wilder Jr., who developed RSI.
It measures the strength of a trend without considering its direction. Readings above 25 typically indicate a strong trend, while those below 20 suggest weak or range-bound conditions.
Integrating ADX with the Xmaster Formula allows traders to confirm whether a signal occurs during a robust or fading trend.
For example, a buy or sell signal from Xmaster can be filtered through the ADX: if the ADX reading is low, it may be wise to wait for stronger trend confirmation; if it’s rising above 25, the Xmaster signal gains credibility as part of a trending environment.
Final Thoughts
The Xmaster Formula MT4 indicator blends simplicity with analytical depth.
It combines moving averages, MACD, and momentum analysis into a color-coded visual system that highlights trend direction, overbought/oversold zones, and reversal points, all without repainting.
Its flexibility across multiple timeframes and asset classes makes it a practical choice for scalpers, intraday traders, and swing traders alike.
To achieve the best results, combine Xmaster MT4 with complementary indicators, apply disciplined risk management, and always test your setup on a demo account before trading live.
Ultimately, the Xmaster Formula MT4 remains one of the most versatile and beginner-friendly tools for traders seeking a reliable, no-repaint trend indicator that simplifies complex market data into clear, actionable insights.
Frequently Asked Questions
1. What is the Xmaster Formula MT4 indicator?
It’s a trend detection tool that combines moving averages and momentum analysis to provide clear buy/sell signals. Green indicates bullish momentum, red signals bearish conditions.
2. How does Xmaster Formula MT4 detect trends?
It uses volatility mapping, adaptive moving gradients, noise filtering, and trend alignment to convert market data into actionable signals.
3. Does Xmaster Formula MT4 repaint signals?
No, once a signal appears on the chart, it stays fixed, ensuring reliable real-time and backtested trading decisions.
4. Can Xmaster Formula MT4 be used alone?
While it’s powerful, combining it with tools like RSI, ADX, or Bollinger Bands improves accuracy and reduces false entries.
5. What timeframes work best with Xmaster Formula MT4?
It performs well on lower timeframes like M5 and M15, ideal for scalping, but reacts more slowly on higher charts such as H4 or daily.