


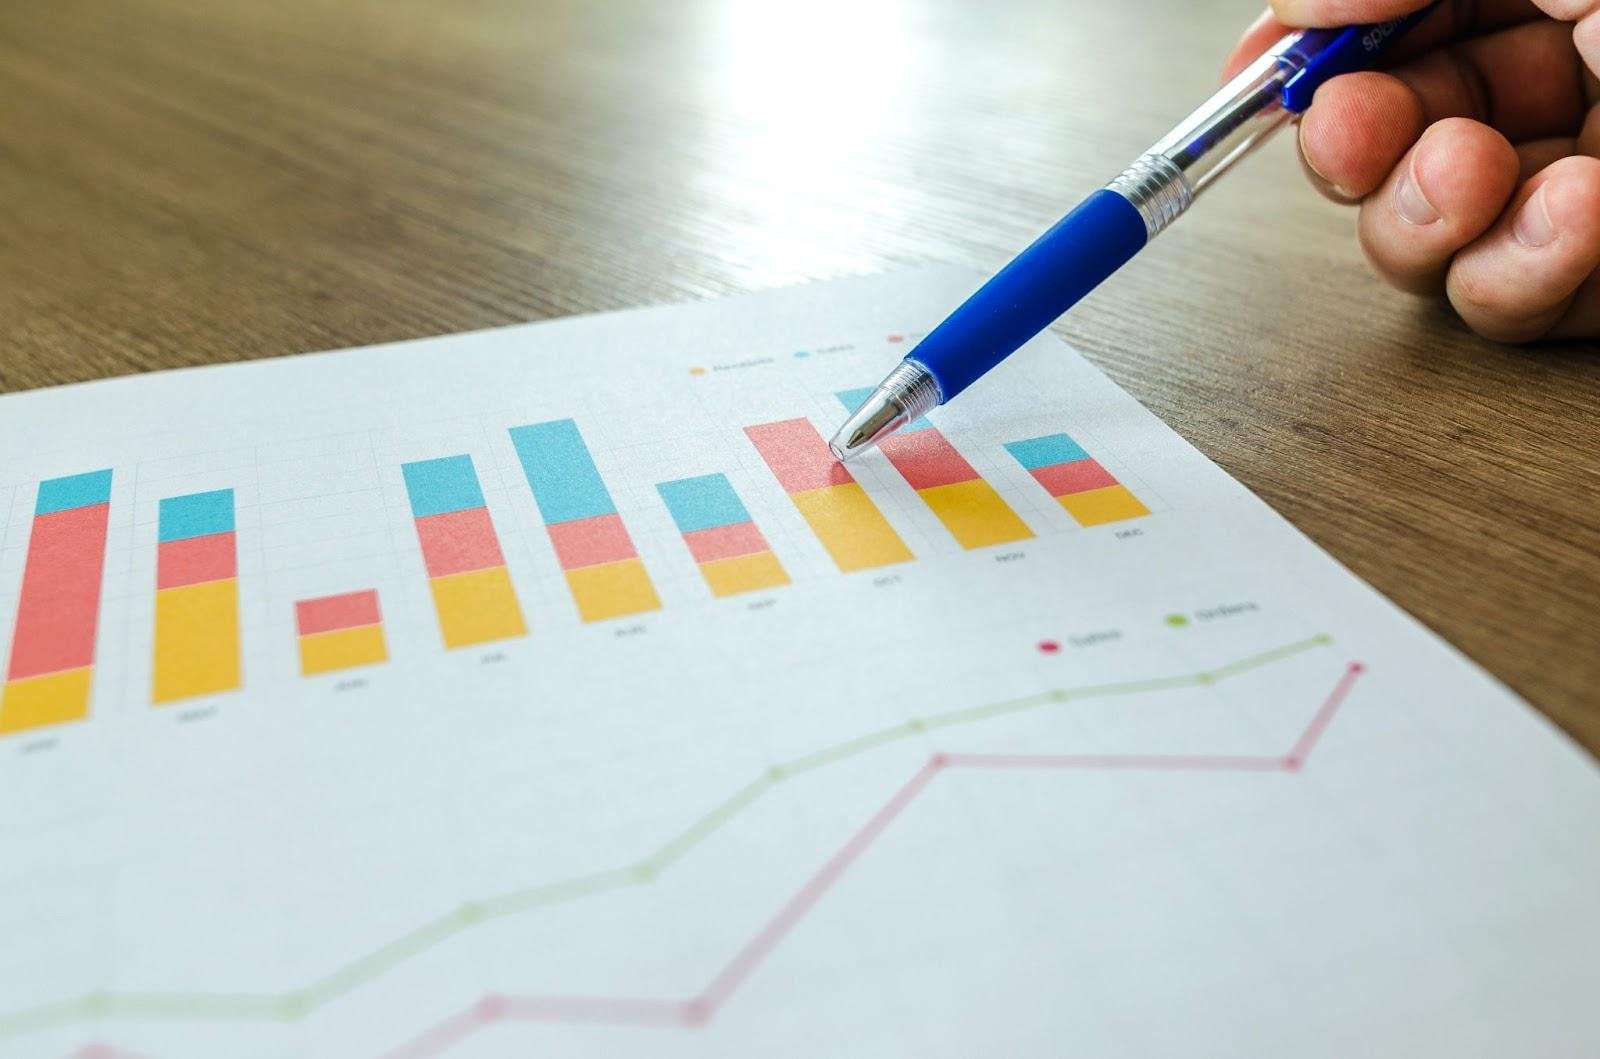
In the world we live in now, where data is very important, it’s essential to share information effectively. The modern visualization techniques are really helpful for making complicated information easy to understand. Advanced graphs and charts have become strong aids that let companies and people show their information in a lively way. This article examines the importance of advanced charts, interactive charts, data storytelling, and various chart types in modern data visualization.
The time when we only used static bar graphs and pie charts has passed. Now, advanced charts have become more important, giving us many ways to show data in a better manner. Heat maps, bubble charts, and radar charts are some examples that give more layers and subtle details to how data is shown. These complex charts move past simple figures by offering a story told through visuals which helps with understanding and keeps people interested.
Interactive charts changed how people engage with data. Viewers are not just watching anymore; they can explore more deeply and get a better grasp of the information shown. Zooming, filtering, and tooltips that you see when hovering help people look into the data their way. It turns the visualization into an experience that feels more personal and deep.
Data storytelling is a skill where you change simple numbers into an interesting story. It’s about showing data in a manner that both gives information and grabs the attention of people who are watching. Advanced graphs provide a visual foundation for telling stories with data, making it easier to understand complicated information.
Choosing the right kind of chart is very important for data visualization. Different charts are good at different things and work best with certain kinds of information or situations. Line charts work well to show trends across time, and scatter plots are very good for showing how variables relate. More advanced charts like Sankey diagrams or treemaps are really useful when you need to picture data that has layers or shows a flow. Knowing the subtle differences between types of charts helps people share information in a way that has more significance.
Practical applications of advanced charts
Advanced charts have many different uses. Businesses use these kinds of charts to help them decide things, watch how well they are doing, and share important plans with others. In the science and research field, advanced charts help to show complicated results in a way that makes it easier for others to understand. Schools use these graphical aids to make education more interesting, transforming numbers into something students can easily grasp and find pleasure in.
Though advanced graphs have many advantages, they also come with difficulties to overcome. Making the visuals too complex can result in misunderstanding instead of making things clear. Finding the correct mix of simple and complex is very important. It’s also necessary to think about whether everyone can understand, since not all people know much about advanced chart types. It’s important to match the visualization way you pick with what your audience knows and can understand.
Modern methods for showing data, like advanced charts, interactive features, data storytelling and different chart types are changing how we talk about and make sense of information. Looking forward to what comes next, combining new technologies and a thoughtful approach to visualization will keep transforming our view on this matter. You can get an in-depth understanding of advanced charts through an amazing book offered by Storytelling with Charts.